Abstract
The UK has fallen behind other comparable European nations in the amount of solar PV capacity installed, in part due to less generous subsidies. To see if this makes sense in terms of voting preferences of those installing solar panels, this study plots solar PV installations on a map of constituencies.
The non-profit Open Climate Fix has amassed precise location information on solar PV in the UK in order to forecast ultra short-term solar energy generation to improve grid efficiency. This is mapped using geopandas with Ordnance Survey constituency data and election data from the House of Commons Library.
The percentage of total PV installations by political party and number of installations per million population by political party are then plotted using full UK solar PV installation figures from National Statistics.
Most solar panels are located in Conservative voting constituencies, therefore it appears that the government has not been serving its voters well on this policy issue.
Political gains to be had from backing Solar PV
The good folks at Open Climate Fix, with their open data and code policy, have made a dataset of precise solar PV locations available which I have mapped against electoral constituencies in Great Britain. It’s a relatively small sample size of 24,000 (compared to the 1m+ locations that exist) but still shows a representative spread with the expected urban concentrations and includes some surprising, at least to me, hotspots, eg Peterborough, Leicester and Colchester.
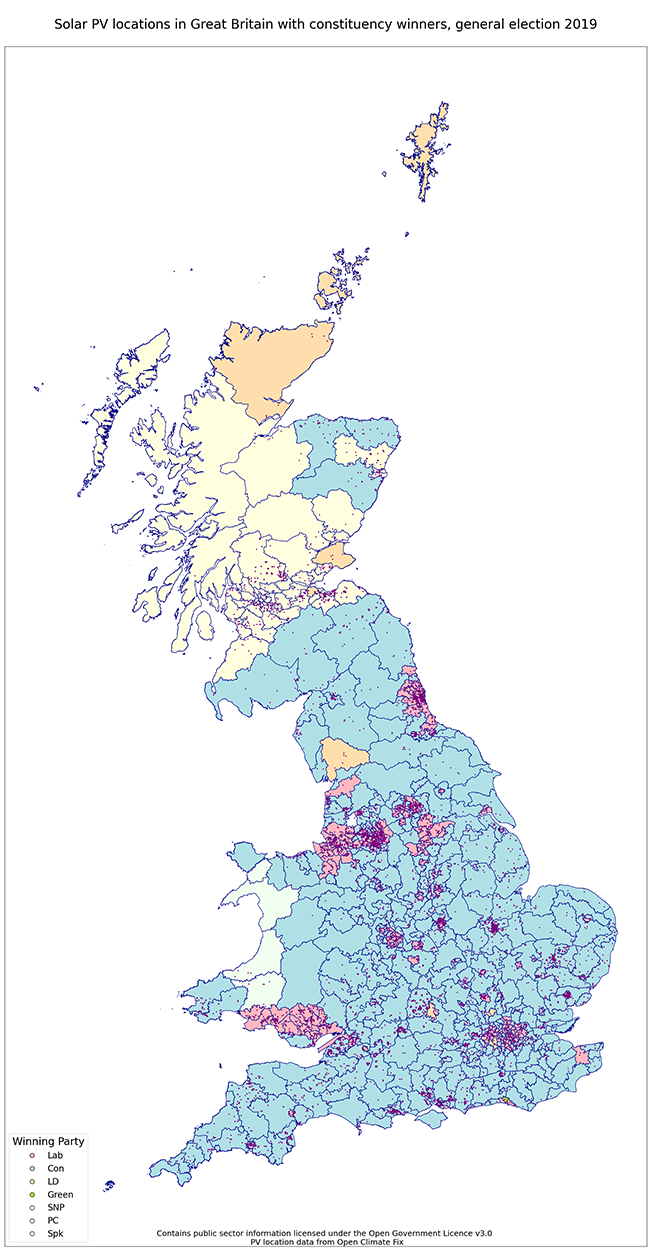
Maybe they are due to local council initiatives – Peterborough had a free solar scheme in 2015 and both Leicestershire and Essex county councils have been running solar group buying schemes – or else it’s down to supercharged reporting of PV installations on the ground in these areas.
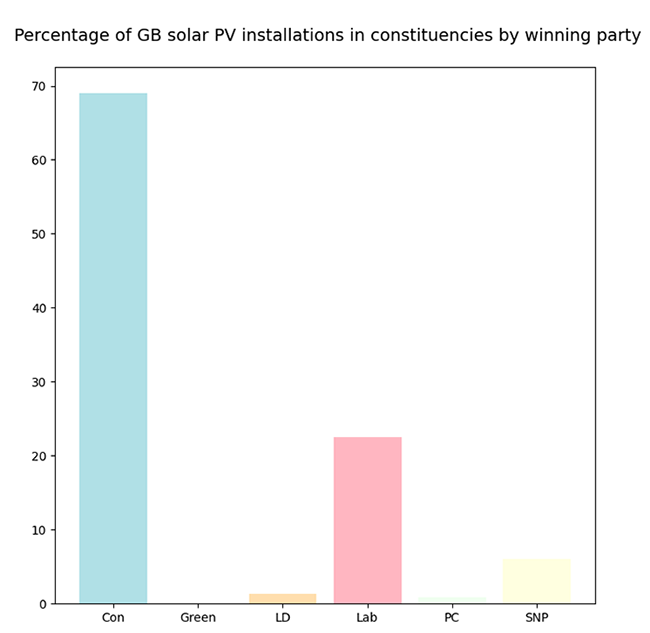
To look in detail at PV locations by constituency winners at the 2019 general election: the UK government figures from BEIS have comprehensive data on all PV installations, which total 1.12m in the UK as of February 2023. This shows urban concentrations of PV sites in Labour seats are completely outweighed by the dispersed spread in more rural Conservative areas – 22.5% and 69% of the UK total respectively – with SNP constituencies taking 6%.
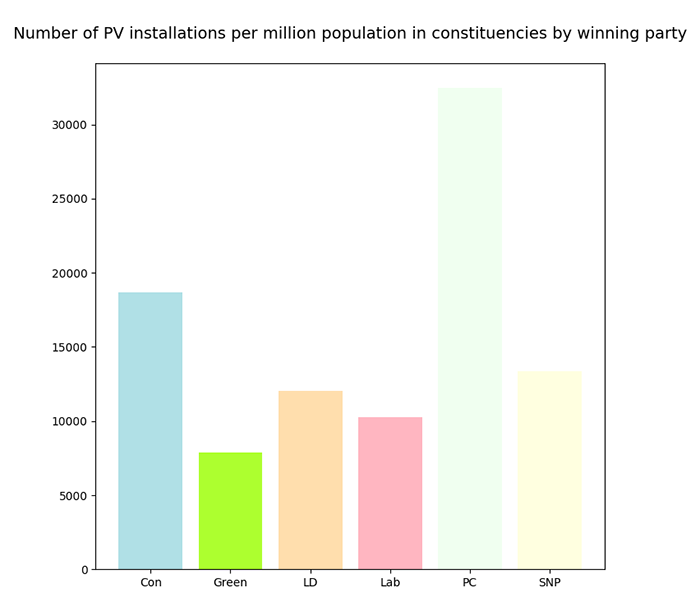
Even taking into account population and looking at the number of PV installations per capita, pro-solar policies would benefit Conservative constituents more than any other party bar Plaid Cymru, with the Conservative figure 1.8 times the Labour number. (Assuming that numbers of PV systems already installed are an indicator of future interest, while recognising installations will have been in wealthier households able to make the investment.)
Add to this that 57% of voters who owned their own home outright voted Conservative, as did 43% with mortgages (home ownership presumably being a near prerequisite for installing solar panels). Also 58% of people intending to vote Conservative at the next election want to see more renewables deployed to bring down bills and 46% of voters say they would be less likely to vote for a party that pledged to get rid of the Net Zero target.
So the question has to be: why is the current government so, most charitably, indifferent to any policies that encourage solar PV installs? This attitude negatively impacts its own voters more than anyone – and a loan scheme, similar to the publicly funded Green Deal it closed in 2015, could finance up front costs at government-level interest rates. Plus a country wide network of solar PV, especially if combined with battery storage, would substantially reduce the cost of national grid upgrades that will have to be made as part of decarbonisation of the energy system.
Whatever the reasons for past policy decisions, the positive news is it’s clear that any political party which provides households with some kind of help on solar will pick up votes in Conservative majority constituencies. Also the first quarter of 2023 has seen the highest number of solar arrays installed (50,700) since late 2015, mainly as a response to the huge rises in energy prices. This will be among better-off households able to finance the up front cost and does not reduce the need for government-backed loans to ensure access for all income levels.
To compare with other European countries, the UK had 14.4GW of solar PV installed in February 2023 which increased by 0.7GW over the previous year, France had 14.7GW installed in June 2021 and has an aid package in place to increase rooftop solar by 3.7GW before 2026, while Germany had 65.9GW installed at the end of 2021, up by 7.2GW the previous year (source Mordor). Germany’s population is c. 23% greater than that of France and GB.
Offering low-cost loans to provide long-term free energy to households: who’s going to vote against that?
NB The figures on PV installations in the UK include all sizes of installation not just residential. however 96.4% are less than or equal to 10kWp, which is the maximum size of almost all residential installations