Abstract
There is a lot of comment about SUVs being one of the global drivers of CO2 output and their increased emissions cancelling out gains in automotive energy efficiency. This study looks at their effect on the UK car fleet emissions by analysing the top ten selling models over 14 years.
Changes in the weighted average emissions of the top 10 cars is plotted in aggregate and individually by SUV and non-SUV categories, followed by a plot of the weighted average mass.
CO2 emissions per kilogram for each category are then analysed to look at the effect of increased aerodynamic drag and rolling resistance of SUVs.
Finally sales figures show the changes in the relative market share of the two categories.
The study shows that SUVs have substantially increased emissions of the most popular cars sold in recent years. Furthermore that it is possible emissions of non-SUVs are higher than they might otherwise be due to design changes in that category.
Analysis
SUVs came into existence via an emissions break granted to US pick-up trucks during the 1970s so that, as working vehicles, they could do their job without being hampered by efficiency standards introduced during the energy crisis. Car makers subsequently realised that the new ‘light truck’ category could be used as the basis for passenger cars that had more relaxed emissions standards and the SUV was born, with the first Jeep Cherokee launched in 1984.
I’ve seen references to the increased emissions caused by SUVs generally but not any details or charts for the UK so I have produced my own from lists of top 10 selling car models by year(1) and published vehicle stats. The effect on overall emissions is clearly dependent on the numbers of each model sold so I’ve used weighted averages to take this into account.
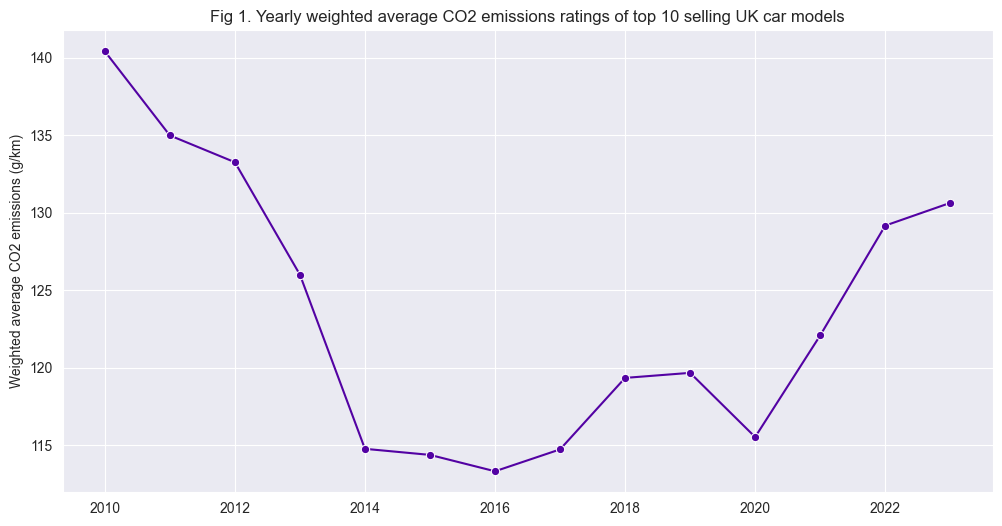
Emissions started rising from 2017 onwards. Is this down to SUVs? Let’s look at the two categories(2) of cars plotted separately.
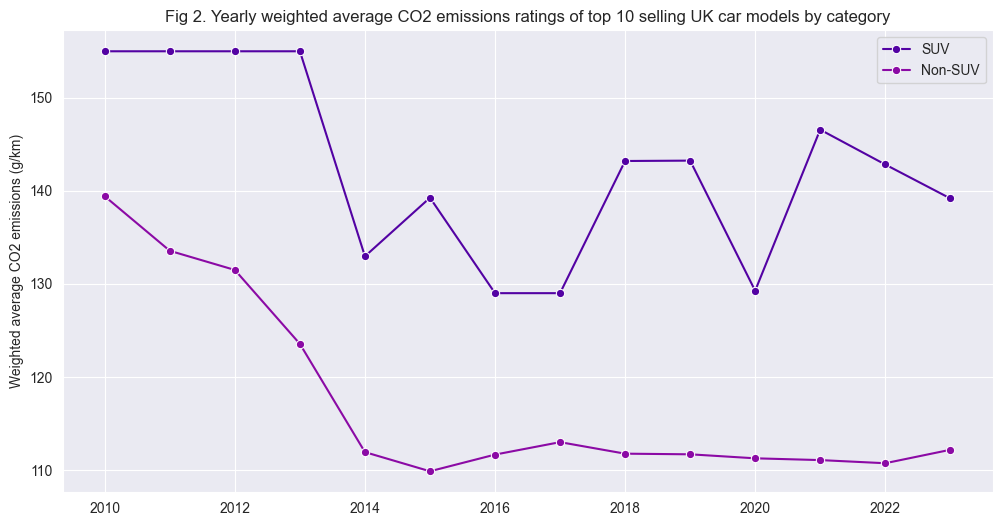
Non-SUVs do show a steady decrease in emissions through to 2015, which is the continuation of a longstanding trend from engineering progress. For example the Vauxhall Astra’s emissions dropped by from 171g/km in 1998 to 102 in 2015, a 40% reduction.
Prior to 2014 the only SUV to make it into the top 10 was the Nissan Qashqai, hence the horizontal line. It was revamped in 2014 and joined by the Nissan Juke, which brought down emissions. But SUV emissions stay much higher than non-SUV emissions throughout, tracking in a band between approximately 18 and 30 percent higher than non-SUVs.
So is it all about the extra weight of SUVs?
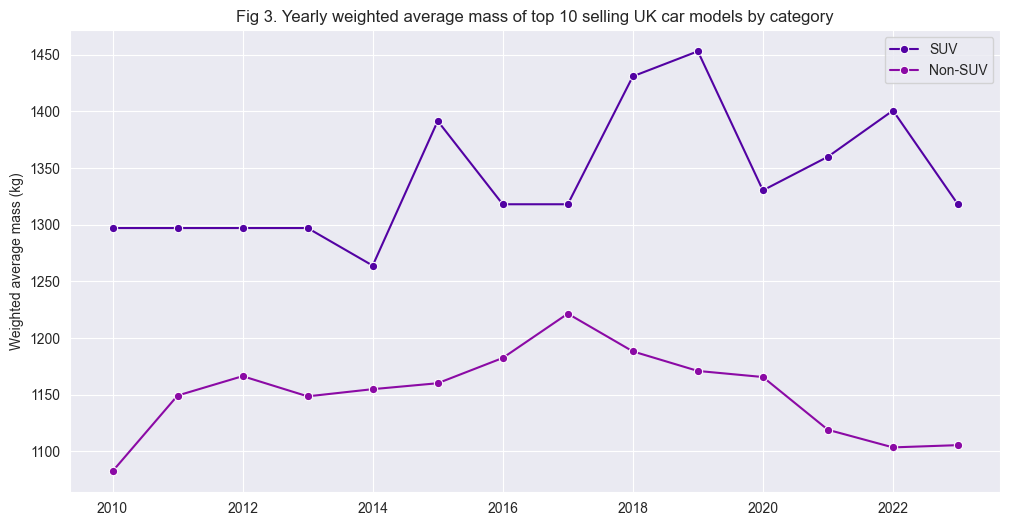
Clearly SUVs are heavier by a good margin. However, non-SUVs increased in mass until 2017, probably as they got better and more sophisticated, with features like aircon. The period around the peak of 2017 is particularly high as premium and so relatively chunky models, like the Mercedes A and C Classes and Audi A3, entered the top 10.
The other major factor affecting emissions is drag, both aerodynamic and the rolling resistance of bigger wheels. To illustrate this we can look at emissions per kilogram.
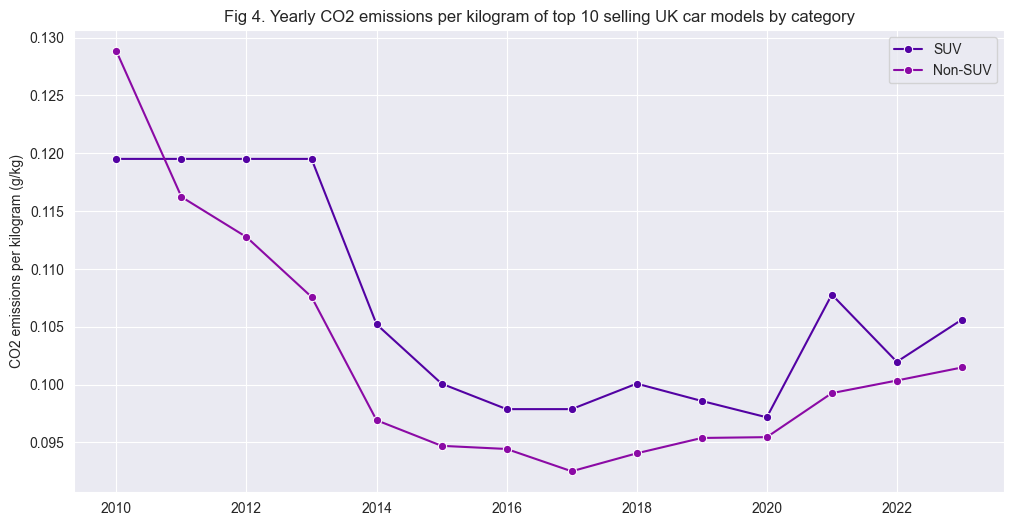
Unsurprisingly bigger SUVs produce more emissions for a given weight of car. It’s interesting to see that non-SUVs’ emissions per kilogram have also increased since 2017 even though both average weight and emissions of cars in this category have decreased. Anecdotally it seems that non-SUV cars have got longer and wider and also appear to have adopted a flatter, taller nose – possibly SUV-influenced design choices. Without this size inflation it is likely that non-SUVs’ emissions would be appreciably lower than they are now, particularly because there has been a circa 10 percent reduction in the weight of cars in this category in the last 6 years.
So where does this leave us? Let’s look at sales numbers.
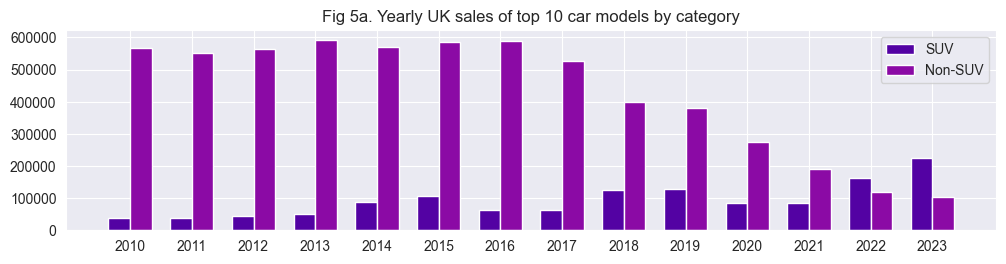
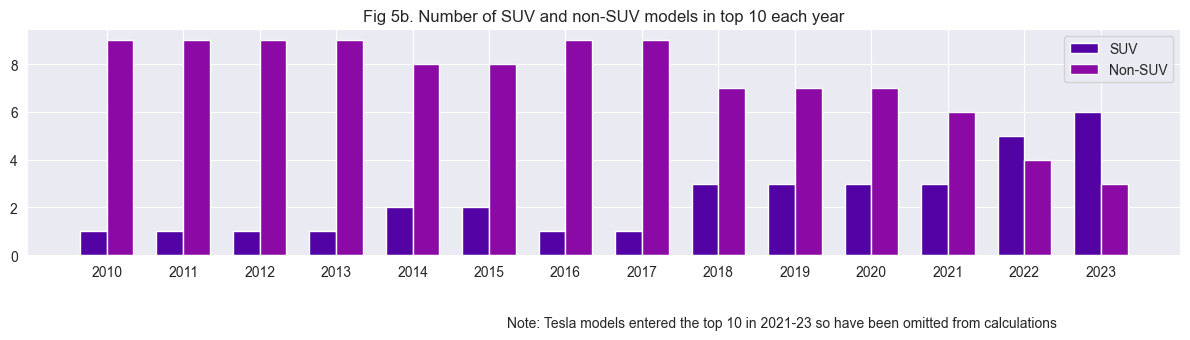
Both the number of SUV models included in the top 10 and the number of SUV cars sold passed the non-SUV figures for the first time in 2022, so sales of SUVs are undoubtedly on the rise. Top 10 car sales make up appproximately 30 percent of total sales in the UK. Looking back at the first chart of combied emissions of all top ten cars, the most marked increases have also been in the last two years.
Leaving aside pros and cons for the cars’ occupants and other road users, from a resource point of view SUVs increase consumption throughout their life-cycle, using more materials to manufacture and more energy to drive. And importantly this will make a difference as the national fleet of cars is electrified. Larger quantities of mineral ores will be needed for batteries and more electricity will be required to charge them, which also increases pressure on the transmission grid.
Does anyone benefit? With SUVs generally significantly more expensive – in 2020 the average retail price of an SUV in Europe was 59% higher than that of a hatchback – car manufacturers do get better profit margins from them despite a decrease in overall sales volumes(3). Consumers clearly like SUVs – but for the average buyer, how much of that preference is because of the manifest benefits of SUV ownership and how much is down to marketing, the influence of TV and film, or following the trend?
Notes
- Tesla entered the top 10 with the Model 3 in 2021 and Model Y in 2022-23. Weight and emissions of electric cars are not directly comparable with petrol powered models so the Teslas are removed from the annual figures, meaning that these years show averages for nine cars, not 10. Furthermore Fig 5a SUV numbers are lower by 34,783, 35,551 and 35,899 in those years. Fig 5b also shows one fewer SUV the same three years
- The non-SUV category is mostly hatchbacks but includes saloons. The SUV category is made up of crossovers and various-sized SUVs. But the top 10 selling list of cars tends to include the lower cost models in both categories
- https://www.jato.com/oems-are-selling-more-suvs-but-are-they-selling-more-vehicles/
- Car sales stats are from best-selling-cars.com and technical stats from parkers.co.uk and autoevolution.com