Abstract
I have created a Tableau Story using the 2023 dataset from Ember energy think tank to analyse global electricity generation trends since 2000. GDP data from the world bank has been added to look at emissions in relation to GDP per capita.
Two static dashboards are below. The full Story with interactive dashboards is here.
Global generation and emissions
The main positive takeaway is that overall the share of renewables is growing as wind and solar take off across the world. By 2022 renewables made up 30% of electricity generation.
Fossil fuels have fallen from a peak of 68% in 2007 to 61%.
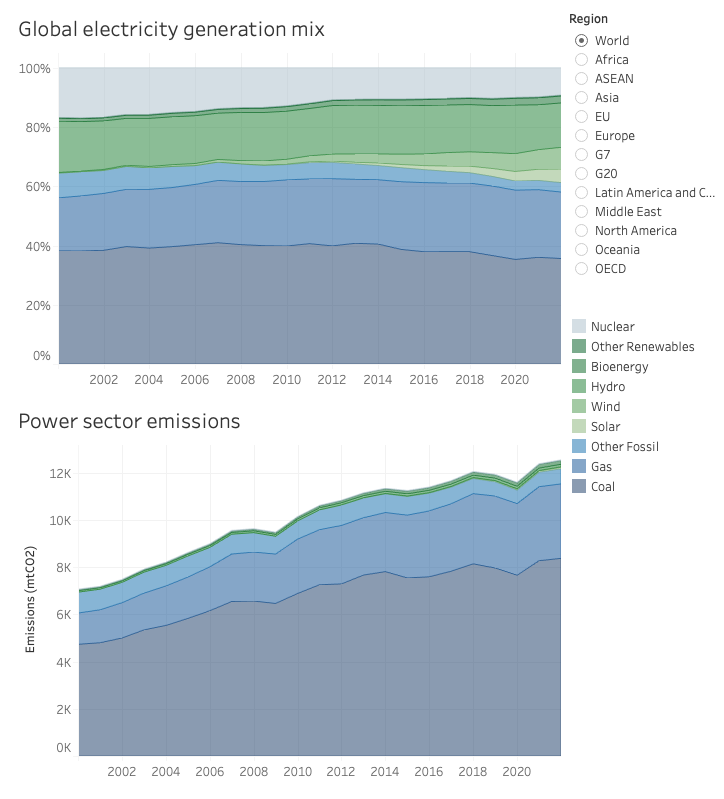
However overall emissions have continued to increase throughout the period, except for during the financial crisis and Covid pandemic.
Coal dominates at over 8 megatonnes of CO2, though there are indications that coal emissions have plateaued. It’s share of overall generation is falling, so it is only the increase in demand for electricity and return to coal in Europe after the Ukraine invasion that prolongs the increase in coal emissions.
Demand and CO2 intensity, generation capacity by fuel type
Despite the near relentless increase in demand for electricity, the carbon intensity – emissions per unit of electricity generated – have started to come down.
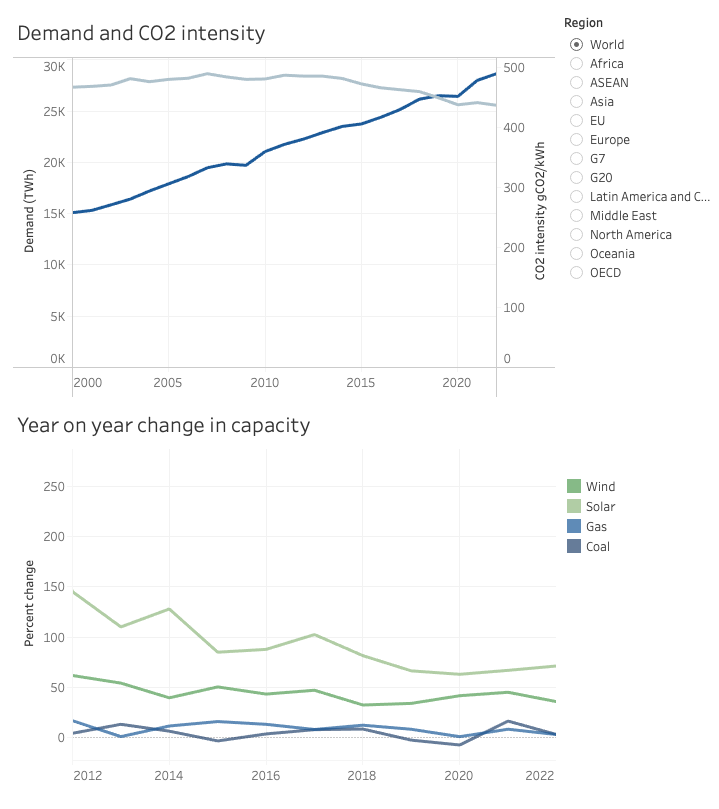
The CO2 intensity should decrease at a faster rate as more renewable capacity is added, particularly in wind and solar.
Coal generation was actually decreasing before 2021 when the world economy started to rebound after the hard lockdowns at the start of the pandemic and Europe had to restart coal fired power stations as gas imports from Russia fell. It is likely that coal use will decline again as more renewables capacity comes online.